Rolling noise
Train Noise Expert allows the calculation of rolling noise sound power (and indicative sound pressure levels) from input data related to train speed, and the properties of wheel and track components.
Calculation flowchart
The rolling noise calculation procedure is performed in accordance with the following diagram:
Rolling noise theory
The calculation of rolling noise is essentially performed in accordance with the approach developed by Prof. David Thompson during the 1990’s, which has also been used in the TWINS rolling noise software.
After the initial development of the theory [1]–[5], a comprehensive validation study was completed [6], [7]. This involved three different wheel and track designs, and three or four train speeds in the range 50 to 160 km/h, with a total of 25 different combinations. Additional validation was performed after some updates to the prediction model in 1999 [8].
After these updates, predictions of the original validation cases were found to be slightly higher (+2.7 dB) than their measured values. In his book [9], Thompson states that differences between model and measured values can be attributed to deficiencies in the measured input data (particularly roughness and track decay rates) as well as simplifications in the model approach.
More recently, improvements have been made to the prediction approach to include:
- Modal sleeper response [8];
- Additional rail radiation effects of the rail gap [10];
- Effects of ballast on rail and sleeper radiation [11];
- Effects of track absorption on noise from the bogie cavity [12];
- Effects of discrete support spacing [9].
Additional work in this field is ongoing, and we will include updates to the model used in Train Noise Expert once they are published and have undergone validation checks.
[1] D. J. Thompson, ‘Wheel-rail noise generation, part I: Introduction and interaction model’, J Sound Vib, vol. 161, no. 3, 1993, doi: 10.1006/jsvi.1993.1082.
[2] D. J. Thompson, ‘Wheel-rail noise generation, part II: Wheel vibration’, J Sound Vib, vol. 161, no. 3, 1993, doi: 10.1006/jsvi.1993.1083.
[3] D. J. Thompson, ‘Wheel-rail noise generation, part III: Rail vibration’, J Sound Vib, vol. 161, no. 3, 1993, doi: 10.1006/jsvi.1993.1084.
[4] D. J. Thompson, ‘Wheel-rail noise generation, part IV: Contact zone and results’, J Sound Vib, vol. 161, no. 3, 1993, doi: 10.1006/jsvi.1993.1085.
[5] D. J. Thompson, ‘Wheel-rail noise generation, part V: Inclusion of wheel rotation’, J Sound Vib, vol. 161, no. 3, 1993, doi: 10.1006/jsvi.1993.1086.
[6] D. J. Thompson, B. Hemsworth, and N. Vincent, ‘Experimental Validation of the TWINS Prediction Program for Rolling Noise - Part 1: Description of the Model and Method’, J Sound Vib, vol. 193, no. 1, pp. 123–135, 1996.
[7] D. J. Thompson, P. Fodiman, and H. Mahé, ‘Experimental validation of the twins prediction program for rolling noise, part 2: Results’, J Sound Vib, vol. 193, no. 1, 1996, doi: 10.1006/jsvi.1996.0253.
[8] C. J. C. Jones and D. J. Thompson, ‘Extended validation of a theoretical model for railway rolling noise using novel wheel and track designs’, in Journal of Sound and Vibration, 2003, vol. 267, no. 3. doi: 10.1016/S0022-460X(03)00711-9.
[9] D. J. Thompson, Railway Noise and Vibration: Mechanisms, Modelling and Means of Control. Elsevier Ltd, 2009.
[10] X. Zhang, D. Thompson, E. Quaranta, and G. Squicciarini, ‘An engineering model for the prediction of the sound radiation from a railway track’, J Sound Vib, vol. 461, 2019, doi: 10.1016/j.jsv.2019.114921.
[11] X. Zhang, D. Thompson, H. Jeong, and G. Squicciarini, ‘The effects of ballast on the sound radiation from railway track’, J Sound Vib, vol. 399, 2017, doi: 10.1016/j.jsv.2017.02.009.
[12] X. Zhang, H. Jeong, D. Thompson, and G. Squicciarini, ‘The noise radiated by ballasted and slab tracks’, Applied Acoustics, vol. 151, 2019, doi: 10.1016/j.apacoust.2019.03.012.
Axlebox/bogie transfer functions
As a beta feature, the velocity response at prescribed locations on the bogie frame can be calculated.
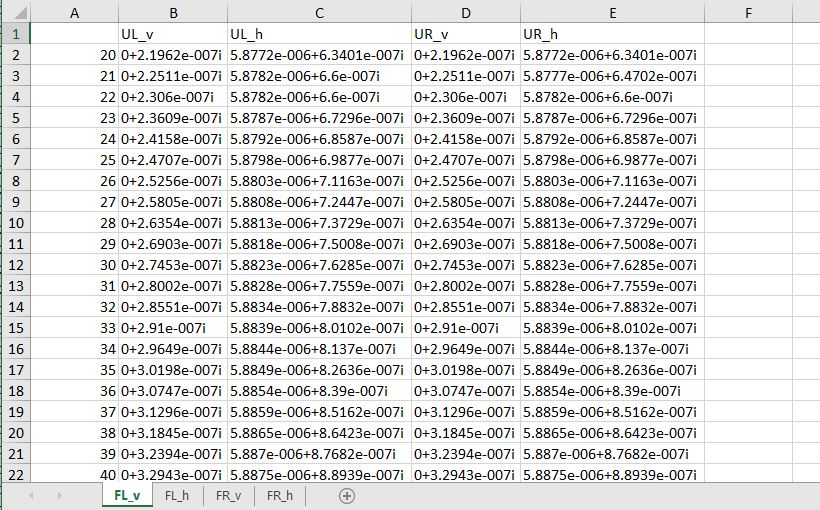
The first part of the calculation is to determine the response of the axlebox. The rolling interaction force is applied to the axlebox mobilities, which are supplied by specifying an Excel workbook (.xlsx file). The workbook needs four worksheets, labelled ‘FL_v’, ‘FL_h’, ‘FR_v’ and ‘FR_h’ representing vertical and horizontal forces at the left and right wheel contact points, as shown below. The first column of each sheet must have a narrowband frequency spectrum (in Hz). The remaining columns should provide the mobility values (complex values, in m/s/N) to the axlebox locations in the following order: ‘UL_v’, ‘UL_h’,‘UR_v’ and ‘UR_h’. Appropriate positions for these are shown below.

Axlebox force positions and response positions
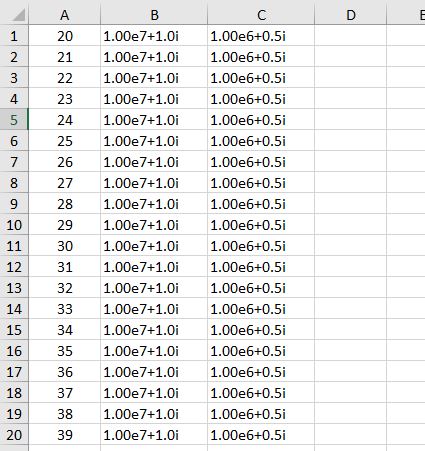
To calculate the force on the bogie the stiffness and damping of the primary suspension system must be provided. Whilst the calculation allows constant stiffness and viscous damping values to be specified, it is recommended to provide frequency-dependent transfer stiffness values with a spreadsheet (.xlsx file). These should be in narrowband and complex (to include the damping term). The first column must have a narrowband frequency spectrum (in Hz). The remaining columns should provide the vertical and lateral transfer stiffness values (complex values, in N/m), respectively. An example is shown below.
When calculating the force on the bogie, several assumptions must be made:
- the bogie frame does not move relative to the axlebox (valid for frequencies sufficiently higher than the secondary suspension natural frequency).
- the stiffness and damping act on the same point on the bogie frame.
- the stiffness values provided are for transfer stiffness.
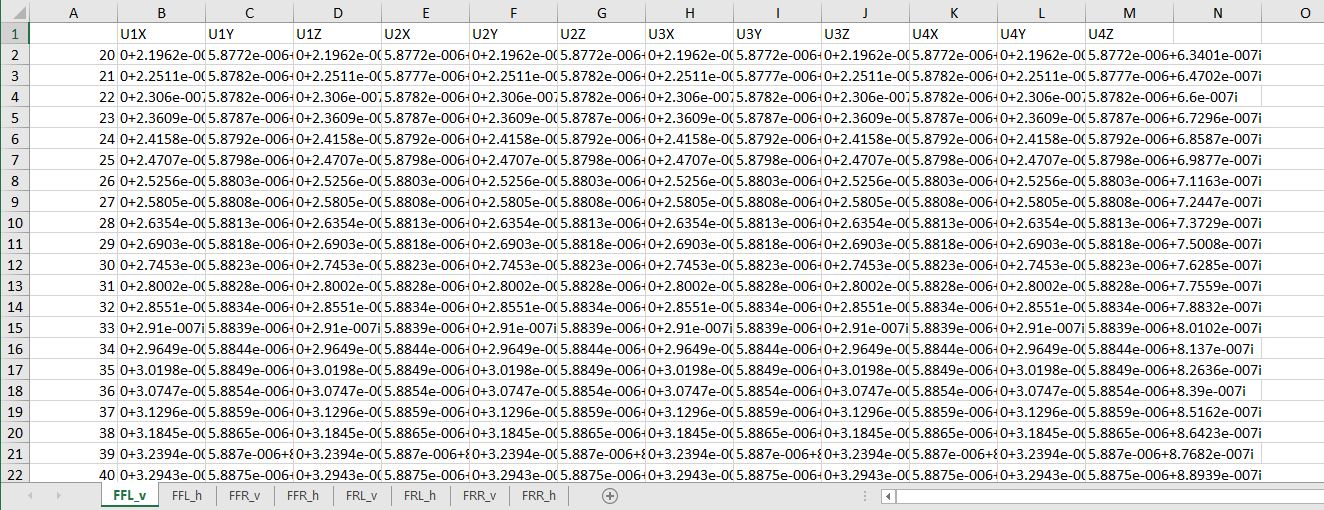
The force on the bogie is applied to the bogie mobilities, which are supplied by specifying an Excel workbook (.xlsx file). The workbook needs eight worksheets, labelled ‘FFL_v’, ‘FFL_h’, ‘FFR_v’, ‘FFR_h’, ‘FRL_v’, ‘FRL_h’, ‘FRR_v’, and ‘FRR_h’ representing the representing vertical and horizontal forces at the front left, front right, rear left and rear right bogie frame connection points, as shown below. The first column of each sheet must have a narrowband frequency spectrum (in Hz). The remaining columns should provide the mobility values (complex values, in m/s/N) to as many bogie frame points (and directions) as required by the end-user, as long as each sheet has the same number and order of columns. Example positions are shown below.
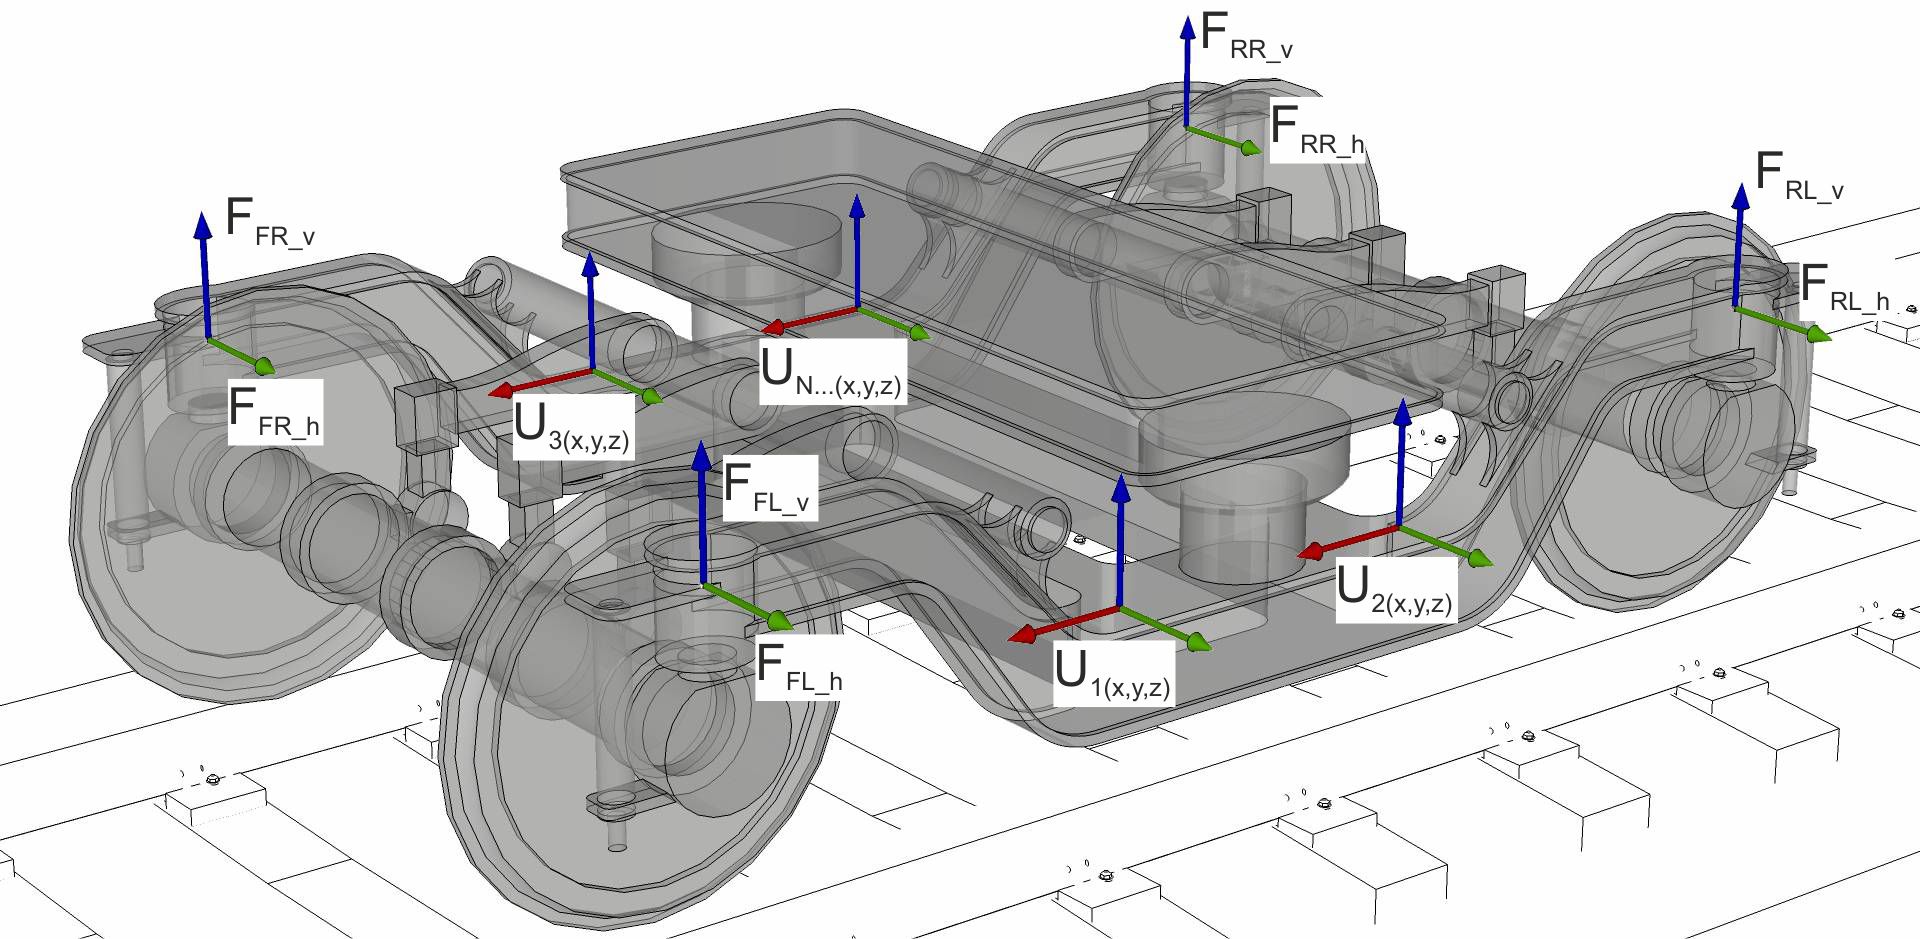
Bogie frame force positions and example response positions
The output of the calculation is provided as the file roll_bogieResponse.csv in the results folder. The output file gives the response velocity (in m/s) at each of the specified positions, over a narrowband spectrum with a resolution of 1 Hz. Since extrapolation is used for frequencies outside of the data provided, care should be taken to ensure that the supplied data will cover the full frequency range in the output.