Viewing results
Train Noise Expert includes powerful tools to select, view and export data from your calculations.
Plotting results
Data is automatically plotted and shown after running a rolling noise or external noise calculation. At any other time, you can plot data from your results by selecting Project > ‘Review results…’.
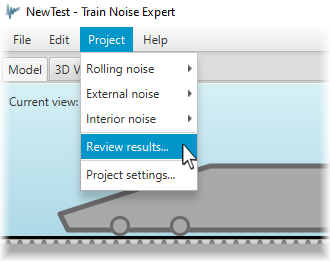
Menu option for reviewing results.
On selecting ‘Review results…’, a new window will appear, which will list all of the results for the current project. From here you can select one and click ‘Ok’ to plot its data. You can also achieve the same result by simply double-clicking on the result you wish to view.
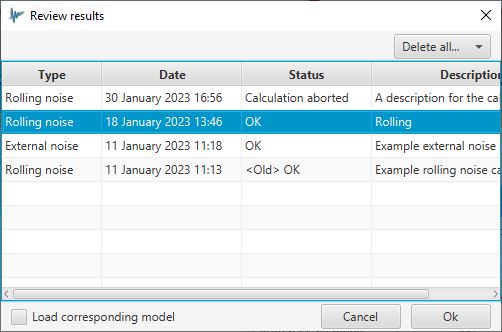
Window for viewing/managing results.
Some other options are available from this window, including:
- “Load corresponding model” - if this is enabled, then the model parameters used for the selected results will be loaded into memory, replacing the current model. Make sure you have saved your working model before selecting this option.
- “Delete all…” - options to delete (1) all results, (2) just those with errors, or (3) all except the latest succesful results.
- Right-clicking on individual result presents the option to go to a specific result’s folder, delete the result or to change its description.
Interacting with charts
When the charts are first displayed, Train Noise Expert will plot some intial data but not the whole dataset - this would take some time to plot, and would cause the chart to be cluttered. To select the data to plot, use the checkboxes in the ‘Source data’ pane. If you wish to quickly select all or none, you can do this by right-clicking in this area. Once you have selected the appropriate source data, click the “Refresh results” button to plot the results on the charts.

Select the results to be plotted in the 'Source data' panel.
For convenience, by right-clicking on receivers, you can add receivers to a ‘favourites’ collection. This enables a quick selection of just the receivers you are interested in, across all Situations in your results. Your favourites settings are reset for each Train Noise Expert session.

Select 'favourite' receivers for convenient plotting of the data you are most interested in.
To display the overall value of a data series (for sound pressure and sound power results), click on the line or legend entry; the overall value will be shown in the bottom-right region of the screen. Use the up or down keys to select alternative lines.
To display the data value of a specific data point on a chart, click on the line marker; the value will be shown in the bottom-right region of the screen. Adjacent values of the data series can be selected by using the left or right arrows on the keyboard (even for data point values located between line markers).
Most of the chart axes are auto-ranging by default. Auto-ranging can be turned on/off through a menu that appears when right-clicking on an axis. From this menu you may also manually define the upper and lower limits of the axis. The axes can also be automatically scaled by double-clicking on the axis.
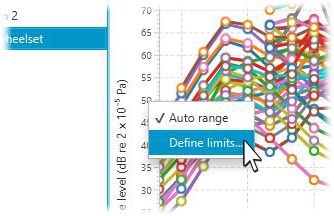
Right-clicking on an axis presents options for scaling.
Train Noise Expert provide additional options for line/marker colours and series names. To access these options, right-click on the legend to present a menu of options.

Right-clicking on the legend presents additional options.
Train Noise Expert tries to use line and marker colour combinations to differentiate between the many different data serieses that could potentially be plotted. By default, to help keep the colour scheme as simple as possible, Train Noise Expert generates these colours depending on how much data is plotted. However, this means that the colours of a particular data series might change depending on what else is being plotted. To prevent the series colours from changing dynamically like this, select the “Maintain colours” option from the legend menu.
The text in the legend can be simplified/expanded as required by selecting the various fields in the “Text display” option of the legend menu.
To show/hide line markers, select the “Show/hide line markers” option from the legend menu. Note that these line markers do not represent every data point; their purpose is to purely assist with discriminating between different serieses.
Result weightings
The Train Noise Expert default is to display spectra without any frequency weighting applied, and to display overall levels with A-weighting applied. This can be changed by selecting an alternative option from the ‘Results weighting’ selection box in the top right of the window, above the legend.
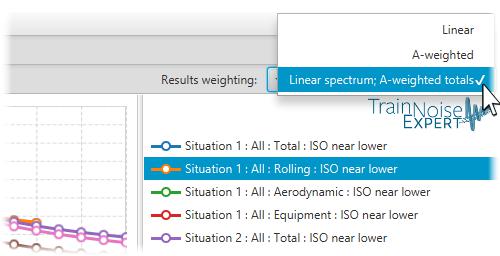
Options for alternative results weightings.
Exporting results
Once you have plotted your data of interest, this can be exported to a file or graphic by right-clicking on the chart. For more information about exporting results, go here: exporting results