External file types
Train Noise Expert allows the use of external files for data input values. The formats of these are outlined here:
For examples of the various file types, please see those included in the application’s default folder. This location is dependent on your own computer, but is likely to be as follows:
C:\Users\{USERNAME}\AppData\Roaming\University of Southampton\Train Noise Expert
where {USERNAME} is your own Windows user name.
.TXT and .TNEI files
Standard text files are used for some files in the software. The format of these files is as described below. Frequencies are typically presented in columns, and each component is separated with a tabspace.
Box source sound power level
Sound power data values are given in dB re 1e-12W.
Line 1: “BoxS”, “Face”, and then the list of frequencies.
Line 2: “0”, “1”, and then the data values for face 1.
Line 3: “0”, “2”, and then the data values for face 2.
Line 4: “0”, “3”, and then the data values for face 3.
Line 5: “0”, “4”, and then the data values for face 4.
Line 6: “0”, “5”, and then the data values for face 5.
Line 7: “0”, “6”, and then the data values for face 6.
The orientation of the faces is assumed to be that shown below:
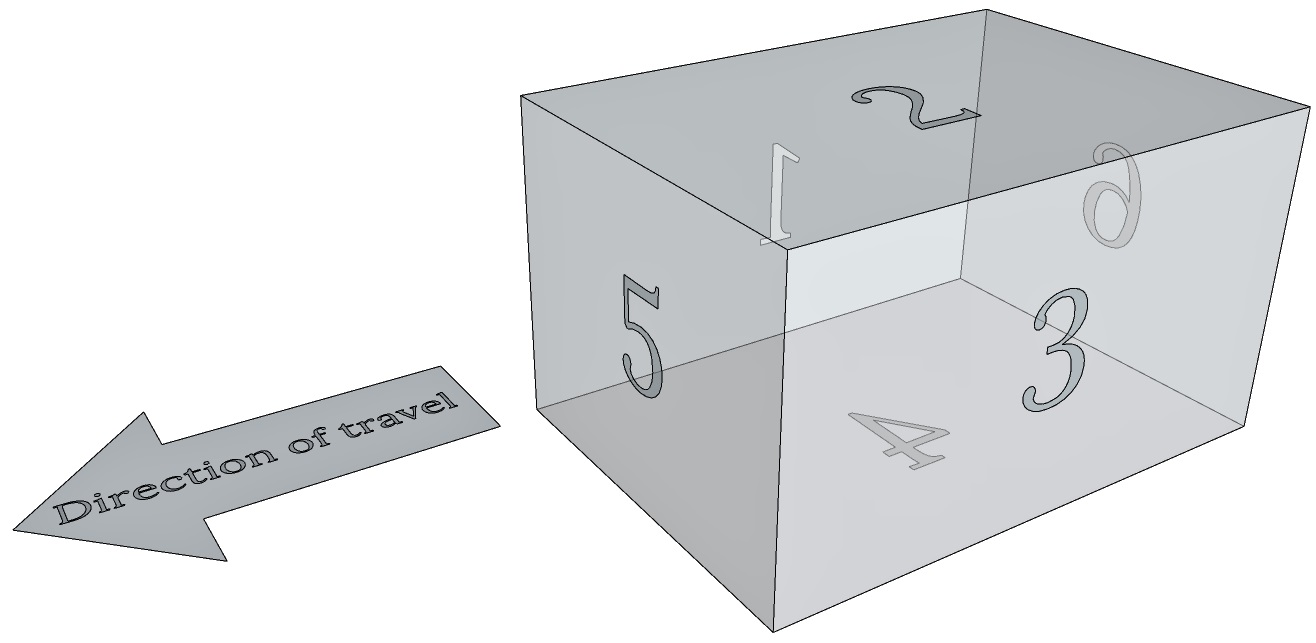
Box source face orientation

Area source sound power level
Sound power data values are given in dB re 1e-12W.
Line 1: “AreaS”, and then the list of frequencies.
Line 2: “0”, and then the data values.

Line source sound power level
Sound power data values are given in dB re 1e-12W/m.
Line 1: “LineS”, and then the list of frequencies.
Line 2: “0”, and then the data values.

Point source sound power level
Sound power data values are given in dB re 1e-12W.
Line 1: “PointS”, and then the list of frequencies.
Line 2: “0”, and then the data values.

Point source directivity
Sound pressure data values are given in dB (arbitrary reference). For each row of data, the radius value must be kept the same, as a measurement sphere is assumed when interpreting the data.
Line 1: “udir”, “radius”, “theta”, “phi” and then the list of frequencies.
Line 2: “0”, the radius value (in m), the theta value (in degrees), the phi value (in degrees), and then the list of sound pressure levels.
Line 2 is then repeated for all measurement points.
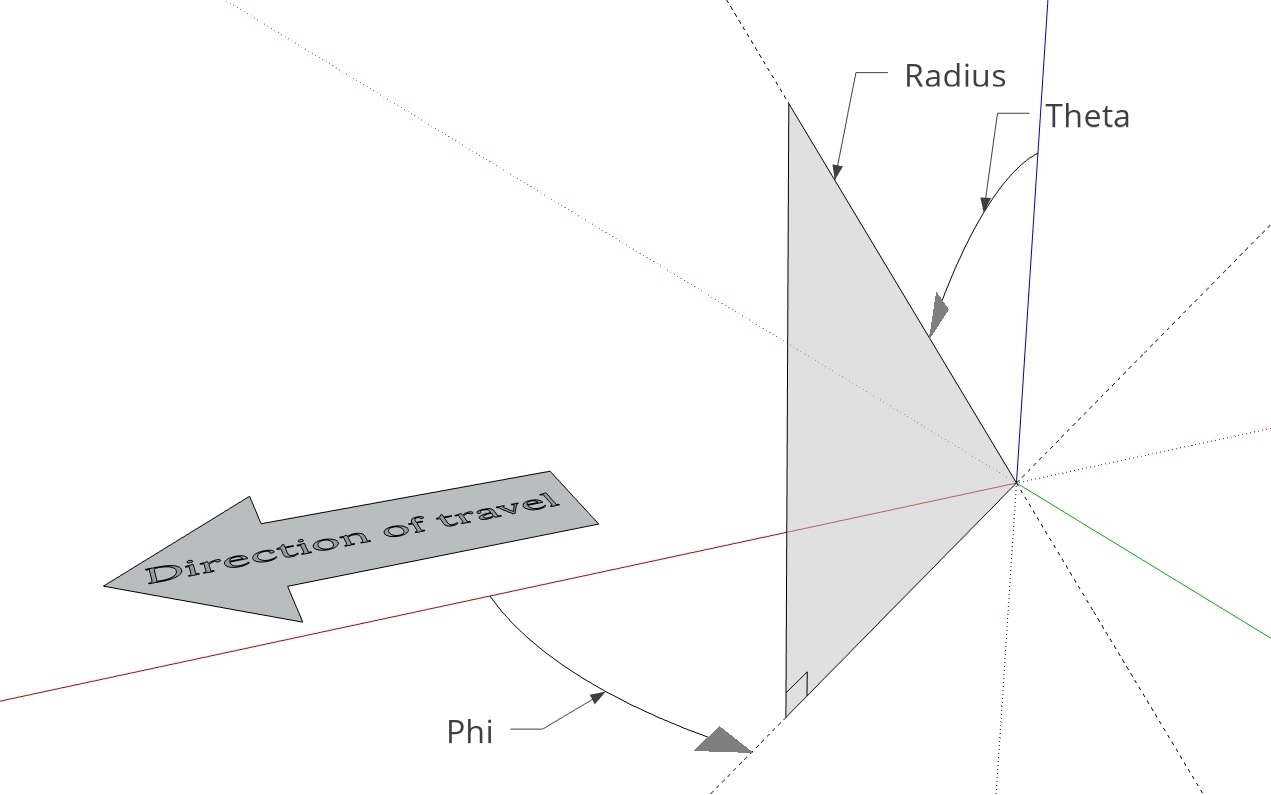
Point source directivity input file structure

- At the calculation stage, in order to get the directivity in any necessary direction defined by the relative position between the source and receiver, the nearest available measurement point is adopted. The level of accuracy depends mostly on the amount of measurement points on the sphere compared to the directivity of the source. It is up to the user to define a measurement grid which is fine enough to be representative of the actual directivity of the source.
- It is assumed that the measurement points over the sphere are defined in such a way to divide the sphere into equal areas. This assumption is used in converting sound pressure levels into directivity factor.
Narrowband base spectrum
Sound data values are given in dB but as they are not used as absolute values (only to ‘shape’ the auralisation output in each 1⁄3 octave band) they could represent sound pressure or sound power levels. For appropriate results, we recommend a frequency resolution of at least 1Hz with linear spacing between 0 and at least 10kHz. For these files, frequencies are listed in rows rather than columns (due to the amount of data required).
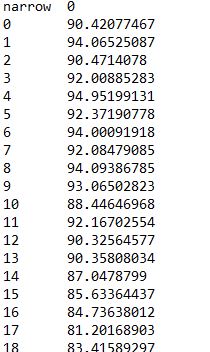
Line 1: “narrow 0”.
Subsequent lines: Frequency (in Hz), tab, and the data value (in dB).
.TO files
.TO files are used for some input files in Train Noise Expert. These are text files, with a ‘.TO’ file extensions and formatted as follows:
Line 1: File title.
Line 2: Data entry title.
Line 3: Data entry comment.
Line 4: Starting band number, end band number, band fraction number (1 for data in 1⁄3 octaves or 3 for 1⁄1 octaves).
Line 5: The data values, separated by tab or space characters. Line breaks can also be used here; the software will look for the number of data values based on the starting and end band numbers.
Lines 2-5 can then be repeated for additional sets of data.
The band number (N) is defined such that the band value is given by 10^(N/10).
Track decay rate
Track decay rate files require two sets of data, with the bands given in terms of frequency (Hz). In the example below, a frequency band of 20 corresponds to 100Hz, 37 corresponds to 5kHz. For both sets of data, the data values to be given are the attenuation in dB per metre for each frequency band (in ascending frequency order). The first set of data represents the vertical track decay rate; the second represents the lateral.

Roughness
Roughness files require a single set of data, with the bands given in terms of inverse wavelength (1/m). In the example below the starting band corresponds to a wavelength of 0.63m, and the end band corresponds to 0.004m. The data values to be given are the roughness (in dB re 1e-6m) for each wavelength band (in descending wavelength band order).

Rail radiation
Rail radiation files require four sets of data, with the bands given in terms of frequency (Hz). For all sets of data, the data values to be given are the sound power per unit peak velocity (in dB re 1e-12 W/m/s) for 1 metre of rail, for each frequency band (in ascending frequency order). The first set of data represents the vertical propagating wave; the second is the vertical decaying wave; the third is the lateral propagating wave; the fourth is the lateral decaying wave. Due to difficulties in quantifying the decaying wave radiation, the decaying waves are often assigned the same radiation as the propagating waves.

Ballast stiffness
When inputting a frequency dependent vertical ballast stiffness as part of a rolling noise calculation, this is specified with a .TO file containing two sets of data, with the bands given in terms of frequency (Hz).
In the data entry title (line 2), it is highly recommended to indicate the area of the ballast assumed, using curly braces, e.g. “{0.65}m2 ballast”. If a value in curly braces is not found, Train Noise Expert will assume a value of 0.65 m2 for the ballast area when this file is used in rolling noise calculations.
The first set of data represents the ballast stiffness (in dB given as 20log(kb) where kb is the stiffness in N/m) for each frequency band (in ascending frequency order) when considered over the area specified. The second set of data represents the corresponding damping values (in dB given as 10log(eta) where eta is the damping loss factor).

.WHEEL_MODES files
These files are used to describe the modal characteristics of a wheel. These are typically provided by consultancies that perform wheel modal modelling or measurements, and converted the data using the ‘mp_editor’ application/function. This is an advanced feature, for more information please contact us.
Custom graphics .XML files
Custom graphic content (2D and/or 3D) can be added to Train Noise Expert through the use of .XML files. Some experience may be required of xml file formats to use this feature, but examples are provided and are described briefly here. The general structure of the xml file is shown in the example below.
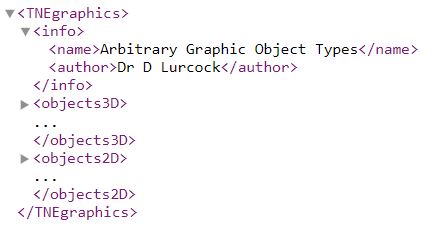
The file must include the xml root element as <TNEgraphics>. Within this, a <info> element can be provided, to provide some basic information about the file, but this is currently not used in Train Noise Expert.
3D graphics are defined with the <objects3D> element. This can include a number of <assembly> elements, that each represent a collection of graphic objects. Each assembly has a <name> element (currently not used) and a <posx> element, which defines the position of the assembly, in metres, down the length of the track. When a custom graphics file is provided for a point source, this value is relative to the point source’s position in the model. When a custom graphics file is provided as an environment background, this value is relative to the front of the train. To repeat an assembly down the track, values can be entered in curly braces: entering “{0, 20, 40}” would result in the assembly being repeated at relative distances of 0 m, 20 m and 40 m.
To each assembly, <object> elements may be added to represent 3D shapes. Currently cuboids and spheres are supported. For guidance on specifying these, please see the example below.

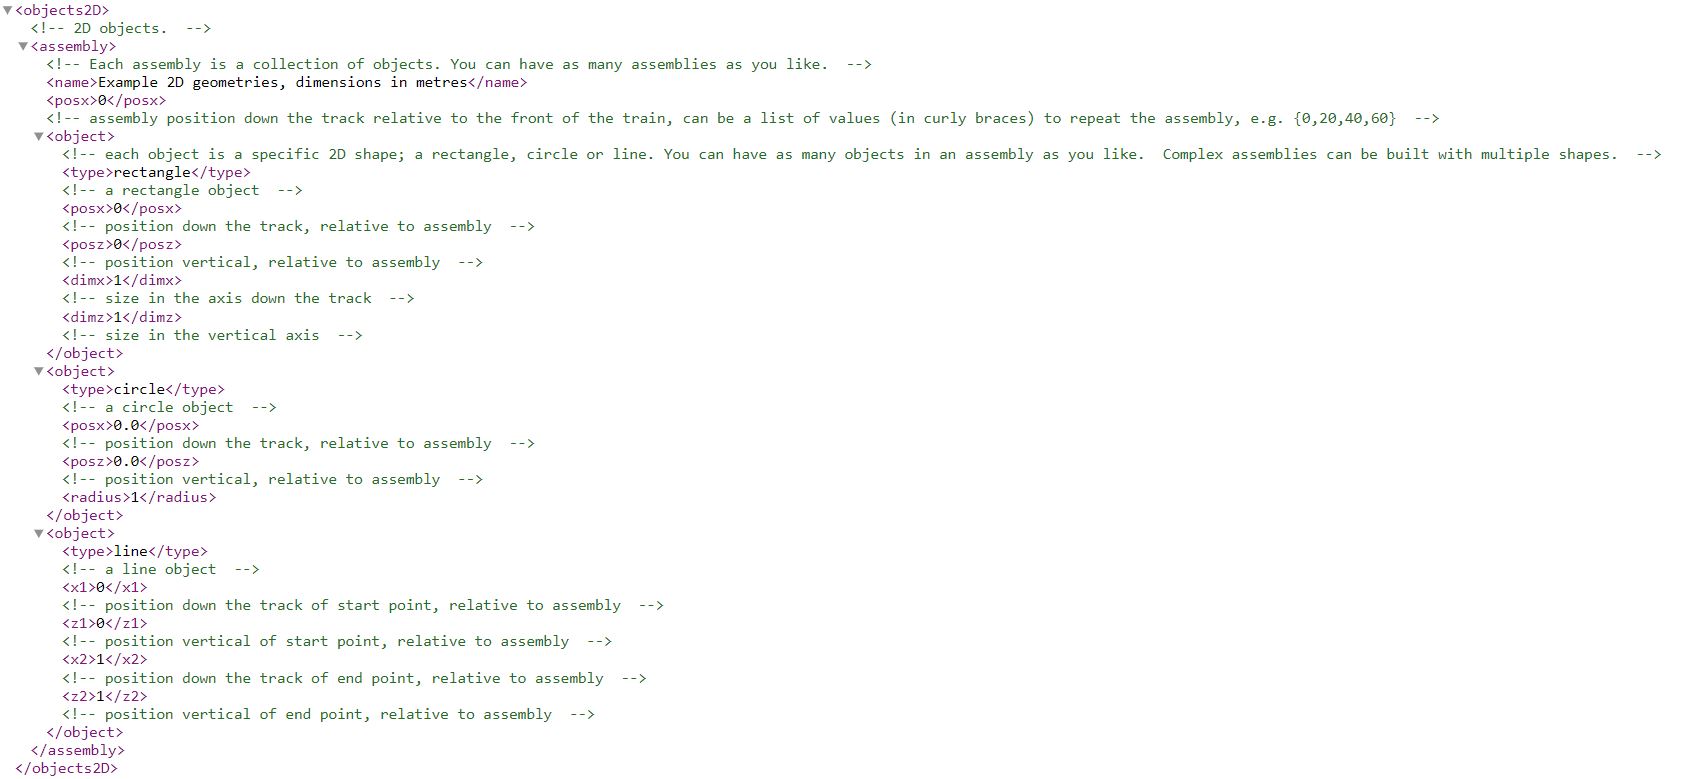
2D graphic objects are handled similarly to 3D objects; these are placed within the <objects2D> element. Currently supported types include rectangles, circles and lines. Guidance on specifying these is provided in the example below.