External noise
The external noise results include a detailed spectrum and time-based plot for each model source and receiver, and an overview of the contributions of each source type to the overall noise level.
All sources
Select the ‘All sources’ tab to view the detailed time and spectrum results for each source or source group.
The upper chart displays the time profile of the selected sources or source groups during the train pass-by. A 2D image of the train associated with this pass-by can be displayed through a menu by right-clicking on the plot. Note that for long trains, this image may simply appear as a line at the top of the chart, so may not be useful unless zoomed in on smaller sections of the time series data.
The lower chart presents the average spectra. For a pass-by, this is the Leq,Tp parameter. For a standstill calculation, this is simply the sound pressure level.
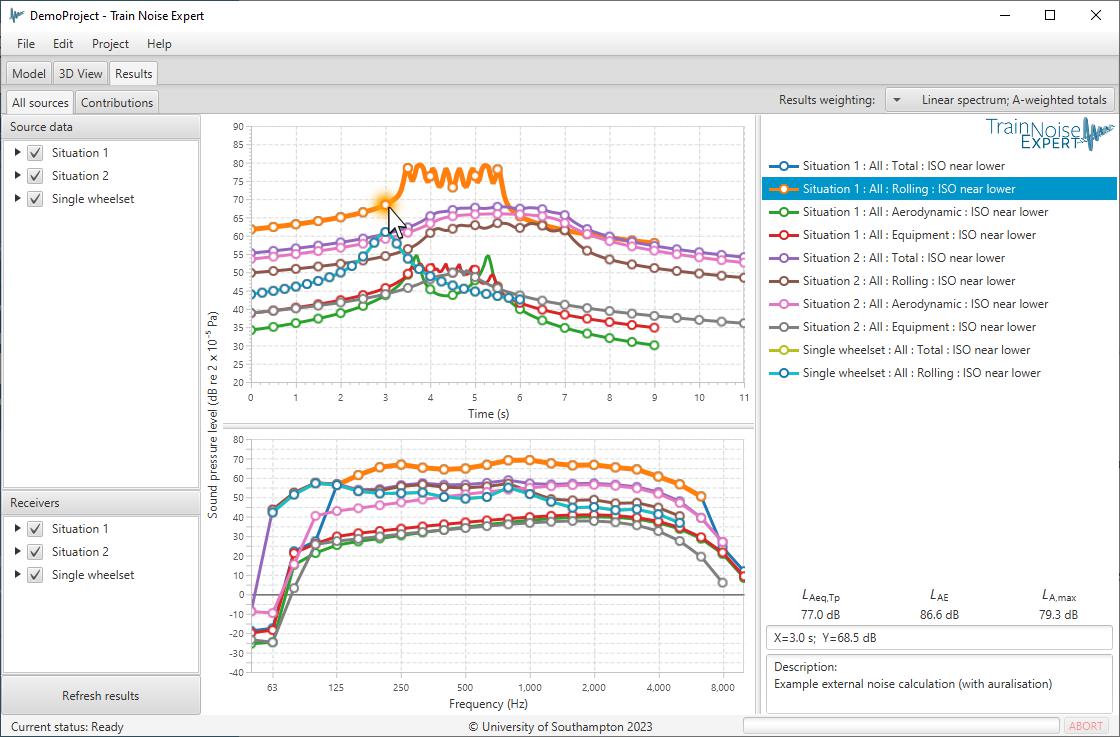
Detailed sound pressure level results from an external noise calculation.
Contributions
Under the ‘Contributions’ results tab, it is possible to view the data in terms of relative overall sound pressure levels. This is helpful to determine which sources and/or source groupings are the most influential on the overall noise level.
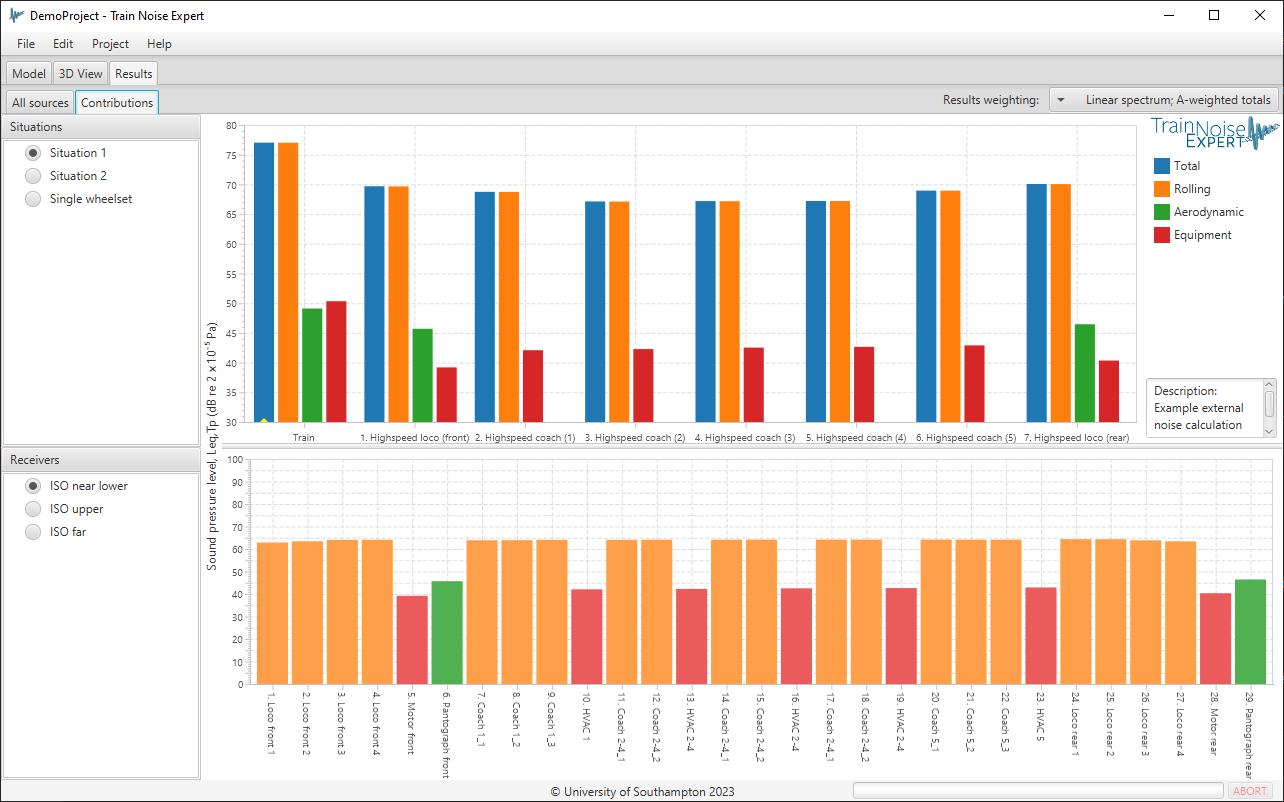
Contribution sound pressure level results from an external noise calculation.
The upper chart shows an overview of sound pressure contributions by vehicle and source grouping. Clicking on any of these will cause the bottom chart to update to a more detailed view of that result. For example, clicking on the rolling noise contribution from one vehicle in the upper chart, will cause the bottom chart to show all of the rolling noise contributions from that particular vehicle.
Hovering the mouse cursor over any result will display a small popup with the overall value. This may or may not be A-weighted, depending on the current result weighting settings.
Results from the contributions plots may be exported through the right-click menu, just like in other charts. For more information about exporting results, go here: exporting results.
Standstill results
For calculations where the train is at standstill, Train Noise Expert will calculate sound pressure levels at all of the defined standstill receiver positions, but three additional ‘special’ recievers are available in the results: ‘Average’, ‘LpUnit’ and ‘LpUnit_upper’.
The ‘Average’ receiver represents a logarithmic average of the sound pressure levels over all the defined standstill receiver positions.
The ‘LpUnit’ receiver represents the result of a full calculation of the Lp,unit parameter, as defined in ISO 3095. For this, Train Noise Expert generates a ‘mesh’ of receivers (completely separate from any other receivers that have been defined in the user interface). This mesh complies with 5.5.1.1 of ISO 3095 (i.e. receiver positions are all 3-5 meters apart, and at a height of 1.2m above the rail).
The ‘LpUnit_upper’ receiver represents the same calculation as the ‘LpUnit’, but for receiver positions at a height of 3.5m. This is only calculated if “1.2 and 3.5m” is selected for the “Standstill LpUnit heights” parameter.

Example mesh of receivers for ISO3095 Lp,unit calculation (view of train from above).
The sound pressure levels at each of the mesh positions are combined to calculate the LpUnit value in accordance with 5.8.1 of ISO 3095:
Where:
| LpAeq,T,i | is the sound pressure level at receiver i (dB), |
| li | is the mesh length associated with the receiver i (i.e. 3 to 5 metres), |
| ltot | is the total length of the mesh perimeter (m), |
| n | is the number of receiver positions. |